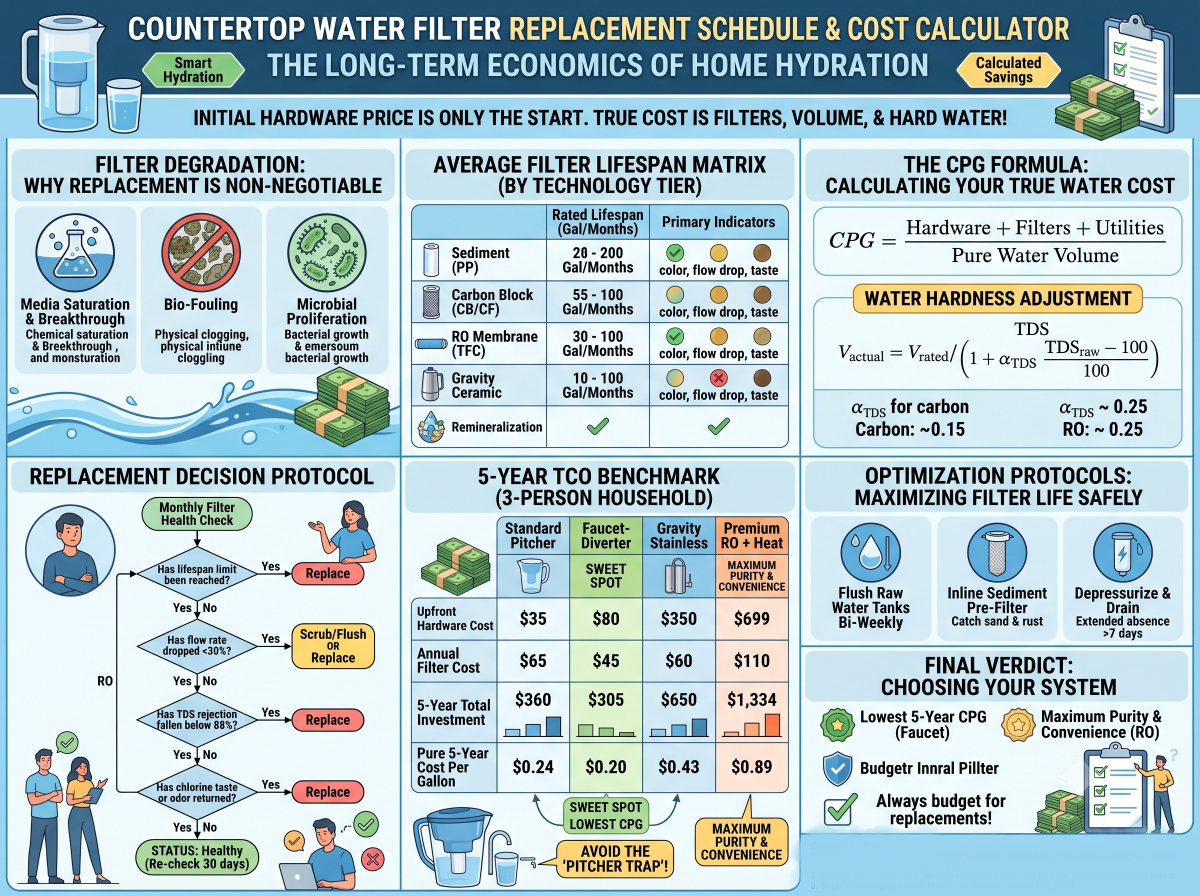
Countertop Water Filter Replacement Schedule & Cost Calculator: The Long-Term Economics of Home Hydration
When evaluating countertop water purifiers, consumers often focus almost exclusively on the initial hardware price tag. A $60 pitcher appears vastly more economical than an $800 countertop Reverse Osmosis (RO) appliance. However, this upfront calculation ignores the fundamental economic reality of liquid filtration: a water purifier is a recurring consumable engine.
Over a three-to-five-year operational lifecycle, the true cost of clean water is driven by filter replacement frequency, gallon throughput capacities, and degradation rates caused by regional raw water chemistry. Replacing filters too late exposes households to chemical breakthrough and biological contamination; replacing them too early burns unnecessary household income.
This comprehensive guide provides the mathematical framework, replacement timelines, and Total Cost of Ownership (TCO) models needed to calculate your exact cost per gallon across every major countertop technology.
=>Check out these Brand products on Amazon:
1. The Science of Filter Exhaustion: Why Timelines Are Non-Negotiable
Delaying filter replacements to save money is a false economy that compromises both water quality and system hardware. Water filters do not fail like lightbulbs by simply turning off; they fail through three distinct degradation mechanisms:
[ FILTER DEGRADATION MECHANISMS ]
 ├─ 1. Media Saturation & Breakthrough  --> Adsorption sites fill up, dumping concentrated contaminants.
 ├─ 2. Physical Bio-Fouling             --> Organic sediment coats pores, causing flow decay and pressure drops.
 └─ 3. Microbial Proliferation         --> Unchlorinated trapped water becomes a breeding ground for bacteria.
Chemical Breakthrough
Activated carbon blocks and ion-exchange resins contain a finite number of chemical bonding sites. Once these sites are saturated with volatile organic compounds (VOCs), chlorine, or PFAS, the filter reaches breakthrough. At this point, incoming water can scour stored contaminants off the media, resulting in dispensed water with higher contaminant concentrations than the raw tap input.
Bio-Fouling & Pressure Drop
In particulate and RO membrane filters, suspended sediment, ferric rust, and micro-colloids physically clog micropores. As pore volume decreases, transmembrane pressure rises, forcing the internal electric pump (or manual gravity head) to work harder, reducing flow rate () and increasing internal strain.
Microbial Heterotrophic Plate Count (HPC) Spike
Once tap water passes through an activated carbon bed, chlorine disinfectant is removed. The moist, carbon-rich environment inside a used filter becomes an ideal habitat for heterotrophic bacteria. If left beyond its rated lifespan (typically 6 to 12 months), microbial growth inside the cartridge can cause a sharp spike in bacterial counts.
2. Filter Lifespan Matrix by Technology Tier
Not all filter cartridges degrade at the same rate. A multi-stage countertop RO unit contains distinct media layers, each with its own operational lifespan:
| Filter Cartridge Type | Core Functional Media | Average Rated Lifespan (Gallons) | Average Time Lifespan (Months) | Primary Failure Indicators |
|---|---|---|---|---|
| Sediment Pre-Filter (PP) | Polypropylene Micro-fiber | Visible brown discoloration, drop in flow rate | ||
| Activated Carbon Block (CB/CF) | Coconut Shell Catalytic Carbon | Chlorine taste/odor return, chemical breakthrough | ||
| Reverse Osmosis Membrane (TFC) | Polyamide Thin-Film Composite | TDS reduction falls below , slow output speed | ||
| Gravity Ceramic Element | Diatomaceous Earth + Silver | Flow drops despite scrub cleaning; ceramic wall thins | ||
| Alkaline Remineralization | Calcite () + Corosex () | Water pH drops below 7.0, loss of crisp mineral taste |
3. The Mathematics of Water Economics: Calculating Cost Per Gallon ()
To make an accurate side-by-side financial comparison between water pitchers, gravity systems, and countertop RO appliances, you must calculate the True Cost Per Gallon ().
The Standardized Formula
The holistic cost per gallon over an operational timeframe ( in years) is calculated as:
Where:
Real-World Water Hardness Adjustment
High Total Dissolved Solids () or high water hardness () accelerates filter clogging. To adjust rated gallon capacity () for local raw water hardness, apply the TDS Load Factor ():
(Where for carbon blocks and $0.25$ for RO membranes).
4. Replacement Decision Protocol
Use this diagnostic flow diagram to determine whether a filter cartridge requires immediate replacement, maintenance, or routine monitoring:
5. 5-Year Total Cost of Ownership (TCO) Calculator Benchmark
The following model compares four common countertop filtration form factors for a standard 3-person household consuming 300 gallons of pure drinking/cooking water per year ( approximately ).
| Cost Element | Standard Pour-Over Pitcher | Direct Faucet Diverter | Gravity Stainless Cylinder | Premium Countertop RO + Heat |
|---|---|---|---|---|
| Upfront Hardware Cost () | $35.00 | $80.00 | $350.00 | $699.00 |
| Rated Filter Lifespan | () | () | () | () |
| Annual Replacement Filter Cost | $65.00 ($8.12/filter) | $45.00 ($15.00/filter) | $60.00 ($120 set / 2 yrs) | $110.00 (RO + Composite) |
| 5-Year Filter Replacement Total | $325.00 | $225.00 | $300.00 | $550.00 |
| 5-Year Utilities (Electricity + Waste) | $0.00 | $0.00 | $0.00 | $85.00 |
| 5-Year Total Investment | $360.00 | $305.00 | $650.00 | $1,334.00 |
| 5-Year Pure Water Volume Produced | ||||
| True 5-Year Cost Per Gallon () | $0.24 / gal | $0.20 / gal | $0.43 / gal | $0.89 / gal |
Key Economic Takeaways:
1. The Pitcher Trap: Pour-over pitchers seem inexpensive initially, but their low gallon capacity () requires 7 to 8 filter changes per year. Over 5 years, replacement filters cost nearly 10 times the original pitcher price.
2. The Faucet-Diverter Value Sweet Spot: Direct faucet filters deliver the lowest overall () for households with standard threaded faucets targeting basic taste and lead reduction.
3. The RO Premium: Countertop RO systems carry a higher (), but this reflects sub-nanometer purification ( PFAS, microplastics, and fluoride rejection) alongside instant thermal features that replace separate kettles and dispensers.
6. Optimization Protocols: Extending Filter Life Safely
While pushing exhausted filters past their chemical limits is hazardous, you can maximize operational lifespan through simple system care:
1. Flush Raw Water Tanks Bi-Weekly: For standalone countertop units, never top off raw water reservoirs without dumping the concentrated residual brine first. Accumulating concentrated minerals in the feed tank scales RO membranes rapidly.
2. Install an Inexpensive Inline Sediment Pre-Filter: If your home water supply has high turbidity or aging municipal mains, adding a 5-micron pre-filter catches sand and rust before it reaches expensive composite or RO cartridges.
3. Depressurize and Drain During Extended Absence: If traveling for more than 7 days, drain countertop reservoirs completely. Standalone water sitting in warm ambient temperatures accelerates bacterial colonization of carbon media.
The Final Verdict
Calculating the true economics of home water filtration requires looking beyond the initial box price:
Main References
1. NSF International. (2023). NSF/ANSI Standard 53: Drinking Water Treatment Units - Health Effects. Ann Arbor, MI: NSF International.
2. Water Quality Association (WQA). (2022). Consumer Water Treatment Product Performance & Lifecycle Cost Analysis. WQA Technical Report Series.
3. U.S. Environmental Protection Agency (EPA). (2021). Optimizing Water Filter Performance and Membrane Replacement Schedules in Small Systems. EPA 810-R-21-003.
4. American Water Works Association (AWWA). (2020). Water Treatment Plant Design: Membrane Filtration Processes and Operations. McGraw-Hill Education, 5th Ed.